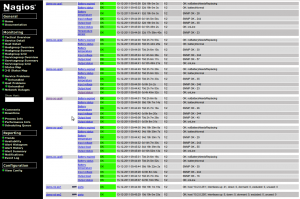
Nagios is the Swiss army knife of monitoring. Out of the box it’ll monitor switches and servers, and a few plugins later will have it watching temperature, voltage, atmospheric pressure and pretty much anything else you want. I’m a big fan.
At a previous place of work, where I was first introduced to Nagios, they had a big telly up on the wall that would display all the alarms and play horrible noises when things went wrong, a bit like a scoreboard. I think they’d written a custom Flash app to take care of the display. A few years later I installed my first Nagios instance, and recreated that display in a combination of C, lex and yacc. After lots of modifications and extra features, I ended up with three thousand lines of completely unmaintainable code. There’s a reason I’m not a developer any more.
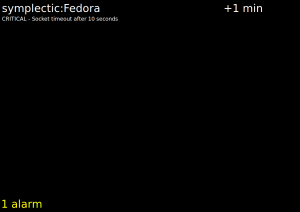
More recently, a colleague showed me how to use a bit of Javascript to make a web page refresh without making the browser re-paint everything. This prompted me to rewrite my scoreboard as a Perl CGI script. It doesn’t have all the features that were present in my C version—most notably, it is mute—but it is only 185 lines. And now, dear reader, you too can have the pleasure of seeing in big, bold letters just how broken everything is.
For this recipe you will need
- A working Nagios installation…
- …that is backed by a database (not status.dat). I recommend ndoutils. Debian-like systems can use the package ndoutils (it needs some configuration after installation).
- Apache 2.x installed and configured on your Nagios server (a fair assumption as Nagios needs it).
- JQuery installed (the Debian package is libjs-jquery.
Download the nagboard perl script and HTML page from the Github repo and stick the files wherever you want to serve them from (I use /var/www/nagboard). Then you’ll need to add something like this to your Apache config:
        <;Directory "/var/www/nagboard/">;
                AllowOverride None
                Options +ExecCGI -MultiViews +SymLinksIfOwnerMatch
                AddHandler cgi-script .pl
        <;/Directory>;
If you’re not already serving the JQuery you’ll also need this (correct for Debian/Ubuntu):
        Alias /js/ /usr/share/javascript/
        <;Directory "/usr/share/javascript">;
                AllowOverride None
                Order allow,deny
                Allow from all
        <;/Directory>;
You’ll also want to have a look at the top of nagboard.pl to make sure that the database credentials are correct. They can be the same as those used by ndoutils, but you could create a new database user with read-only rights to the tables it needs if you’re feeling paranoid. There’s also a section for some MRTG graph URLs (another great tool, by the way) that will be displayed if there are no alarms, so you can keep an eye on network traffic and such things. If you don’t want that, just leave them commented out and the screen will be black if all is well.
Once you’ve got Apache configured, you’ll need to decide how you’re going to display this. A good way is to use Firefox with the Full Fullscreen add-on. This lets nagboard use the entire screen (or big telly, or projector screen…) without any scrollbars, status lines or other browser furniture. It looks nice and minimal. I actually prefer how it looks when there are a few alarms, but then perhaps that’s wrong 🙂
If nagboard is useful to you, I’d love to hear from you. If you’d like to send me ideas for improvement (or, even better, pull requests!) it’d be great to have them.


withanHdammit
Ran across this while looking for ways to enhance my Icinga installation. Had to modify the Perl script a bit because my db tables are all named icinga_ not nagios_ but that was an easy fix.
Would be cool to add some color, maybe make warnings yellow and criticals red?
Thanks for posting this!
withanHdammit
And maybe an option to show all alerts, not just unacknowledged ones.
flup
Thanks for your comment, and I’m glad it’s useful to you! I’ve done what I meant to do ages ago and stick nagboard in a Github repo, so if you feel like adding some code, a pull request would be just lovely 🙂